First published on
Update:
- The number of projects that entered the CDM pipeline increased in the first two quarters of 2010 (See Fig. 1).
- The percent of registered projects that were involved in the review process (which includes projects that require corrections) has been growing over the years (see Fig. 4): 9.5% in 2005, 9.1% in 2006, 19.3% in 2007, 56.9% in 2008, 70.4% in 2009, 53.7% in 2010 (as of July 1, 2010).
- 50% of all hydro projects in the CDM pipeline have requested registration since 2004, while 44% of all hydro projects have actually been registered. Figs. 3 and 4 show the fate of projects requesting registration and being registered by year.
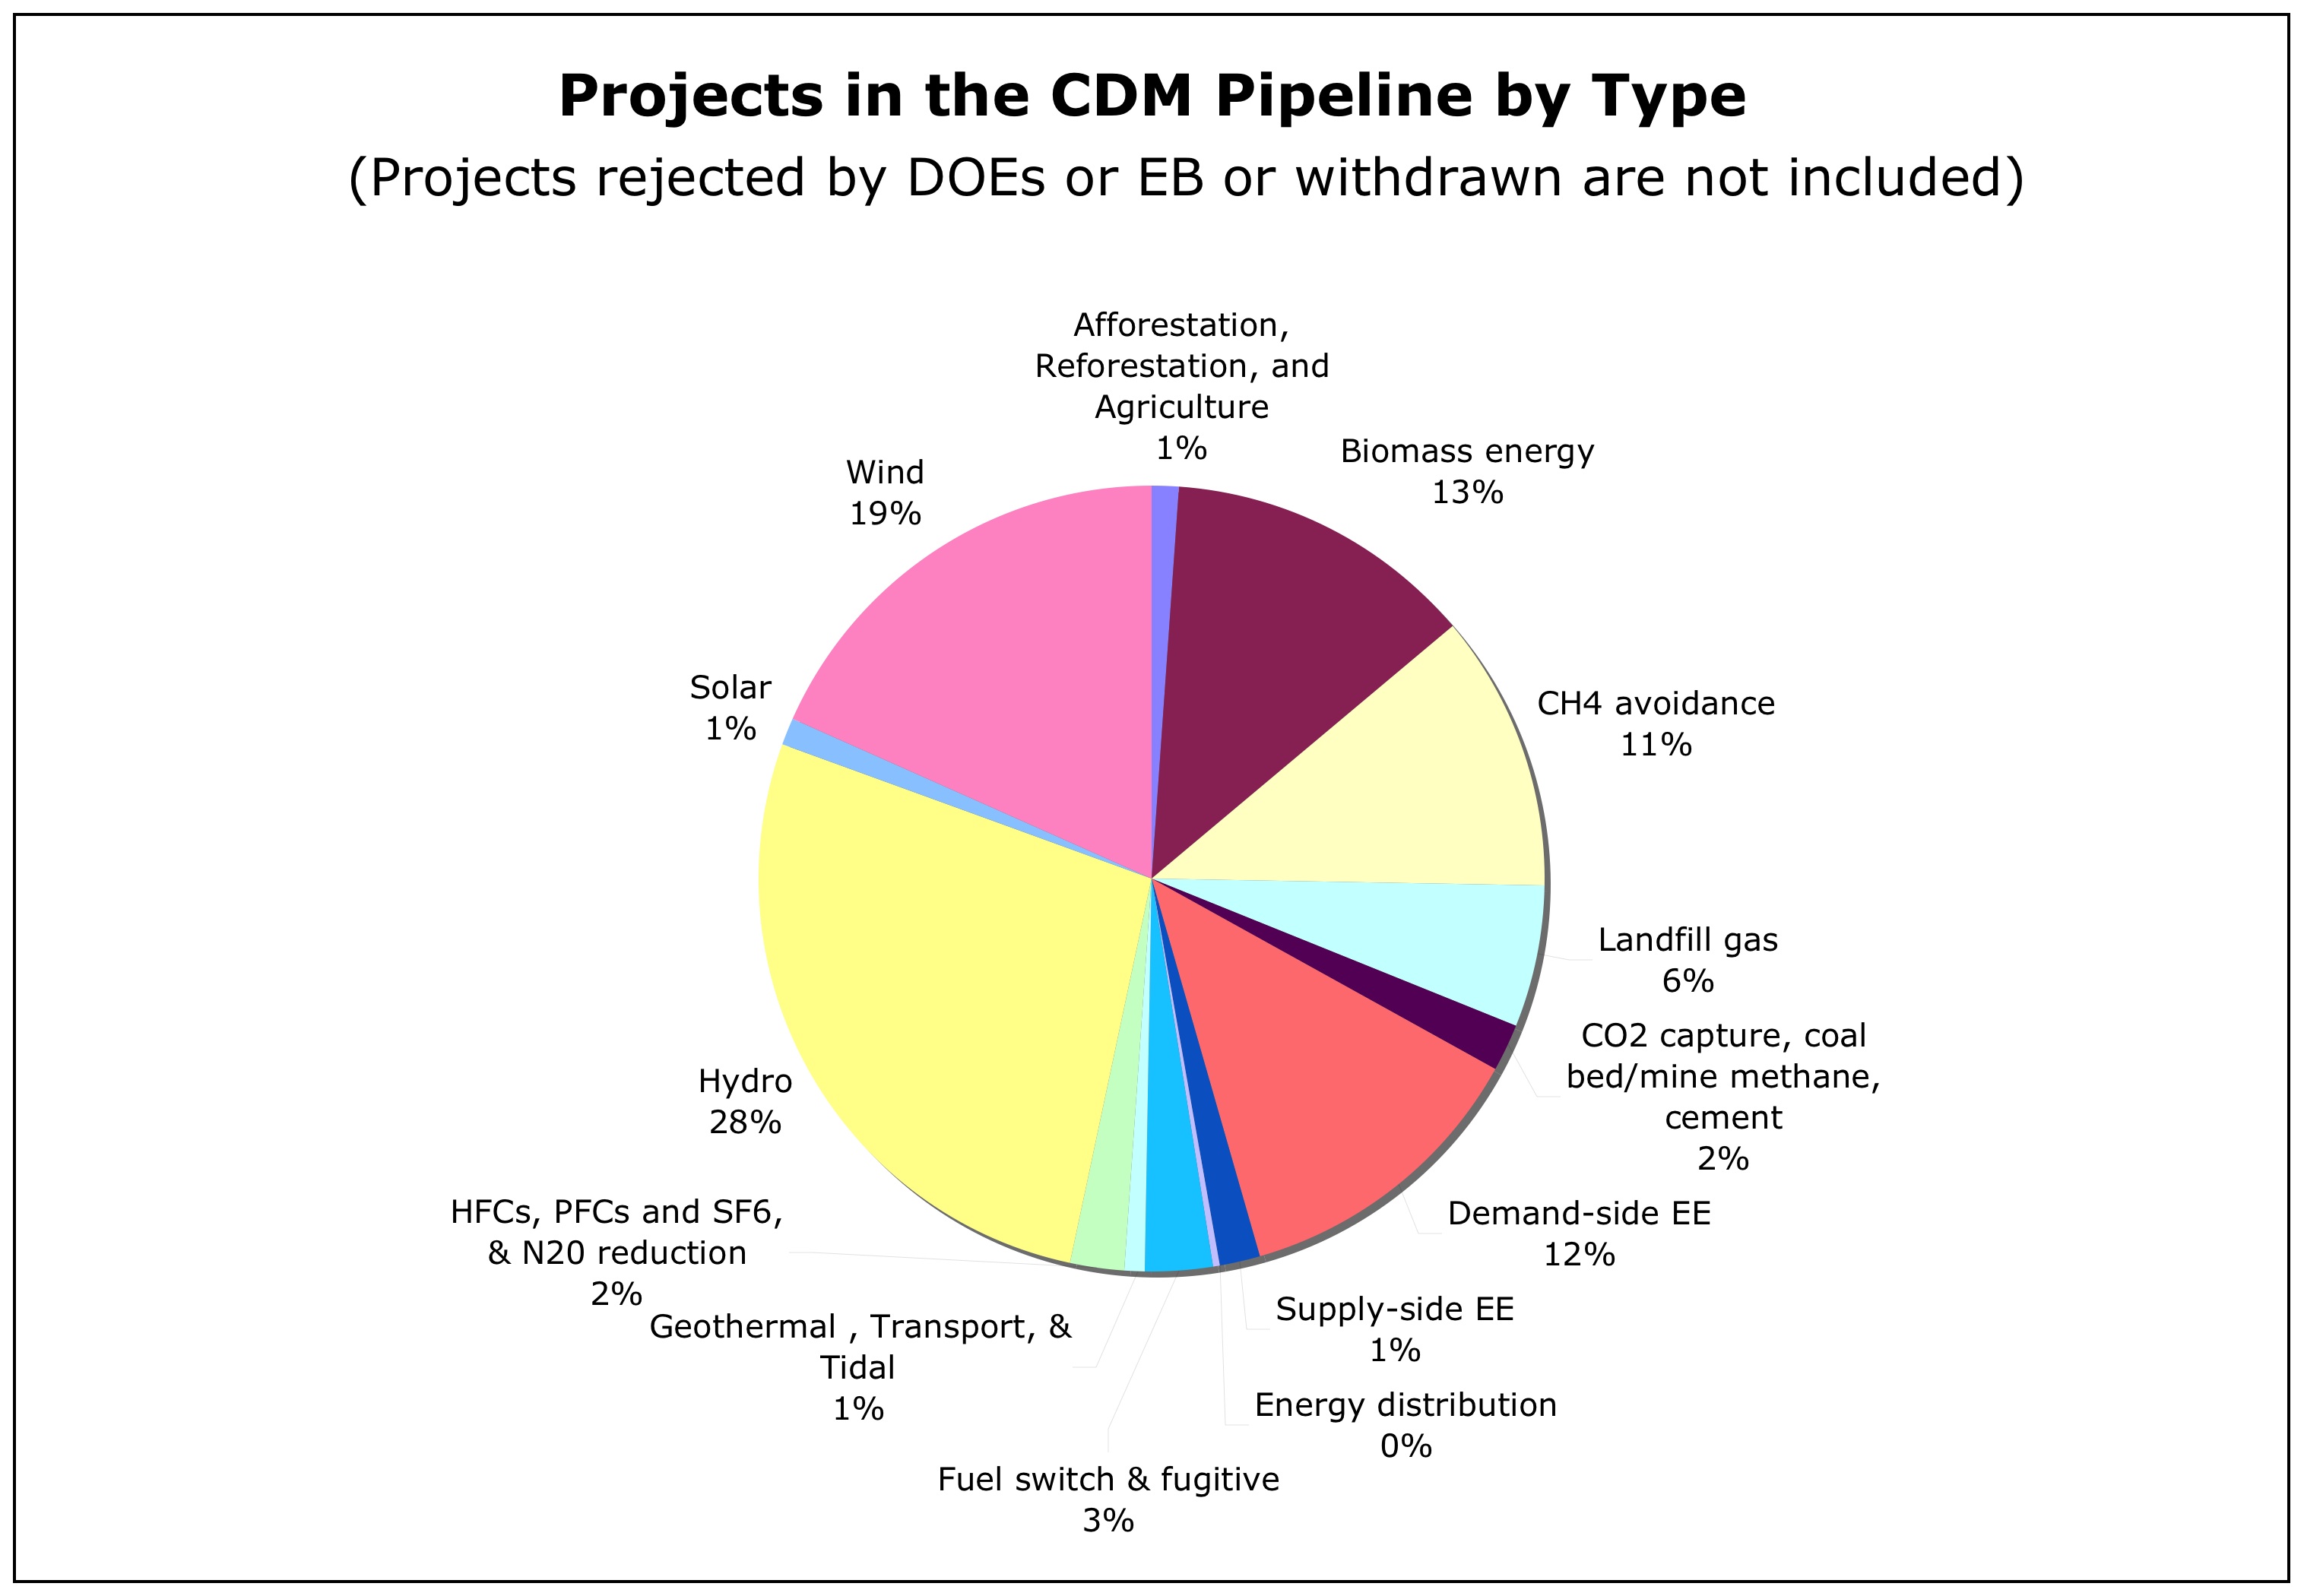
- Hydro projects continue to be the most prevalent type of project in the CDM pipeline (28% of all projects). 63% of credits expected from hydro projects come from China
Click on the following graphs to see a larger version:
 |
 |
 |
 |
 |
 |
You can receive weekly email updates of new CDM hydro projects entering the pipeline and download our monthly spreadsheet by visiting our CDM spreadsheet page. You can see updates from previous quarters here. Data is based on the UNEP Risoe spreadsheet (July 1, 2010) unless otherwise stated. Feel free to contact me about any of these calculations.
More information
- Click here to learn more about the Kyoto Protocol's CDM
- To learn more about submitting comments on CDM project, including what issues to address in your comments, visit our CDM Public Comments page.
- For access to the latest spreadsheet and how you can sign up for weekly updates, go to our Hydro Spreadsheet page.

